
Metformin and Mitochondria: Analysis
Metformin Affects Mitochondrial Function of Mesenchymal Stromal Cells
Arad Jain
Thomas Jefferson High School for Science and Technology
Abstract
Background: Metformin is a well-known drug used to treat diabetes. However, the exact mechanism of action of metformin remains unclear. It’s known that metformin inhibits the mitochondrial respiratory chain complex-I. Metformin also has been shown to prevent cancer cell proliferation. Whether this anti-proliferation effect is restricted only to cancer cells, remains unknown. In this study we investigated whether metformin can affect mitochondrial respiration of an important stem cell, the mesenchymal stromal cells (MSCs).
Methods: Human adipose-derived MSCs were cultured for 72h in presence of increasing concentrations of metformin (0.25-5mM). Oxygen consumption rate (OCR) of MSCs exposed to metformin was evaluated by XF Cell Mitochondrial Stress Test. To evaluate reversibility of metformin effect, MSCs that were previously exposed to metformin for 72hrs, were cultured without metformin for another 7 days, followed by OCR assessment.
Results: MSCs exposed to metformin (0.25mM) demonstrated a 40% reduction, compared to non-exposed MSCs, in basal respiration while MSCs exposed to 1mM or higher conc. of metformin promoted a reduction of approximately 80%. Interestingly, the OCR reduction was reversed once metformin was removed from the cell culture media. Although the viability of MSCs wasn’t affected by metformin, the qPCR mRNA expression of apoptotic genes such as p53, p21 and caspase-3 were increased with metformin concentrations above 1mM.
Conclusion: Our study showed that metformin impairs respiration rates of MSCs, which may have deleterious effect on mesenchymal tissue regeneration in a chronic hyperglycemic milieu. This finding need to be confirmed by exposing MSCs for longer time-periods at even lower concentrations.
Introduction
Dimethyl biguanide (Metformin) is an antihyperglycemic drug which has been prevalent in the field of medicine since the 1950s. Currently, it is one of the most often prescribed medications for patients with Type 2 Diabetes, rising from 51% of patients to 65% between July 2006 and December 2008 [1]. Worldwide, it was prescribed to 120 million patients in 2012. Metformin is used primarily due to its ability to lower blood glucose levels to a more normal value, while rarely leading to hypoglycemia. It also improves insulin sensitivity in diabetic patients, leading to its acceptance as an initial drug for Type 2 Diabetes treatment. More recently, the use of metformin as a cancer prevention agent has been extensively studied, and it has been indicated that Metformin both lowers the risk of diabetic patients developing cancer, as well as working in combination with other cancer therapies to further increase survival rates, and strengthen abilities to fight previously resistant tumors.
A study on rat hepatoma cells has previously investigated the mechanisms by which Metformin decreases the proliferation of cancerous cells. This study showed that the Metformin slowly permeates the inner membrane of the mitochondria, and specifically inhibits complex 1. They believe that metformin acts on the membrane potential of the mitochondria, and therefore will not accumulate in the mitochondria beyond a certain point, allowing use of metformin to be safer than other similar and older drugs such as Phenformin [5]. While this research indicates that metformin may have a positive impact on diabetic patients, very limited research has been done on the effect of the drug on human mesenchymal tissue derived stem cells. If research shows that stem cell growth, proliferation, differentiation and mitochondrial respiration is affected by metformin then its widespread use in a majority of type 2 diabetic patients should be evaluated, particularly when those patients require stem cells for tissue growth and regeneration such as post heart attack or stroke.
In this study, we used Mesenchymal Stromal Cells (MSCs), which are a multipotent cell capable of differentiating into a variety of mesenchymal cell types including, adipocytes, osteoblasts, and chondrocytes. Also commonly grouped with Mesenchymal Stem Cells, though there is debate over the validity of that designation [4], MSCs are vital in tissue repair mechanisms, and the transplantation of Multipotent Mesenchymal Stromal Cells have been shown to stimulate regeneration of organ, muscle, bone, and blood vessels.
Experiments such as the one we performed have been modeled before, using similar methodology. However, this experiment is novel in that it uses stem cells. A 72 hour incubation period of cells in Metformin concentrations between 0.1mM and 5.0 mM were used to study cell viability and proliferations in Medullary Thyroid Cancer cells. The results of that indicated that Metformin had a significant effect on the cells in concentrations greater than 0.5mM after a 72h exposure, so a similar range of values for metformin concentrations were used in this experiment [3].
We expected to see down regulation of genes related to mitochondrial metabolism and production of gluconeogenic enzymes. NDUF should be down regulated to a greater degree than SDHB, indicating Complex 1 dysfunction. We expected to see up regulation of apoptotic genes p51, p21, and Caspase 3. Bcl2 is an inhibitor of apoptosis and is expected to be down regulated. For Cell Viability, we expected to see a dose dependent decrease in cell viability with increasing concentrations of Metformin.
Upon analysis by Seahorse, we expected to see a dose dependent decrease in Basal OCR at increasing concentrations of Metformin. We expect that analysis of the stress test will show that complex 1 inhibition is shown in MSCs as well. Lastly, we will attempt to determine whether the process of cell mitochondrial activity suppressed by Metformin is reversible, that is, how the MSCs would behave after removal of metformin from culture media.
However, there are limitations to our preliminary experiment that we will describe which we anticipate will be addressed in follow up experiments where lower dose of metformin (more physiologically relevant dose) will be used for longer time-periods. 15.0967 µM is the upper limit of the therapeutic range of plasma metformin concentrations [2]. The concentrations that we used for a 72 hour exposure, may exceed normal physiological concentrations.
Metformin may not elicit changes in the expression of genes related to mitochondrial metabolism. According to Viollet et al., “metformin could acutely suppress gluconeogenesis via a transcription-independent process and that changes in gene expression are therefore not the exclusive determinant in the regulation of glucose output.”(2012) It has been proposed that the complex I inhibition is “exerted indirectly by some unidentified signaling pathway,” [5] leading us to believe the defect seen in complex I as a result of metformin exposure may be independent of the transcription of genes related to complex I.
Methods
With the goal being to test the effect of metformin, an oral anti-diabetic hypoglycemic, on the mitochondrial gene expression, mitochondrial respiration and cell viability of Adipose Tissue Derived Human Mesenchymal Stem Cells (AdMSC), the methodology was performed as follows. All experiments were performed in duplicate. AdMSC’s were cultured for 72hrs in media with 0.0, 0.25, 0.5, 1, 2.5, & 5.0 mM, concentrations of Metformin. Cell culture durations and Metformin concentrations were adopted from a similar study that observed metformin’s effect on human medullary thyroid cancer cells. Two vials of Passage 5 AdMSC’s obtained from Lonza were taken out of liquid nitrogen and thawed in a warm water bath. Vials contained 1ml of freezing media and ~1x10^6 cells each. Overall, ~2x10^6 cells were thawed and plated on 2x 100mm plates. Media (Normal Glucose DMEM w/ 10% FBS and 2% Pen/Strep) was added to achieve 7ml per plate. Media was aspirated, cells were rinsed with 2 ml PBS and media refreshed in 24hrs to remove freezing media. Media was changed again in 72 additional hours, and cells were split on day 6, into 6 x 100 mm plates (Passage 6). Cells will be cultured and split again into sufficient plates to achieve 3 x 60 mm plates per experimental concentration.
A stock solution of 0.5 M Metformin in NG DMEM was created by weighing 0.828g of Metformin Hydrochloride (Molecular weight 165.6 g/mol) and dissolving in 10mL of Normal Glucose DMEM. From the stock solution, 15mL of each desired concentration were prepared by mixing appropriate amounts of stock solution and Normal Glucose DMEM. 18x60mm plates of cultured AdMSC at 70%-80% confluence were obtained. Media was aspirated and washed with 2mL of PBS. Metformin containing (except 0.0mM which was just Normal Glucose DMEM) media prepared earlier were added to respective plates such that there were 3 plates per concentration. Cells were then incubated at 37º C and 5% CO2.
From each concentration, we performed qPCR, Cell Viability/Counting with Trypan Blue (trypan blue stain helps to detect damaged or apoptotic cells), and Seahorse Analysis of Oxygen Consumption Rate (OCR). For qPCR and Cell Viability, one 60 mm plate per experimental concentration was counted and after 72hrs. The plate was aspirated of media, and washed with 2mL of PBS. 3. 750 µl of 0.25% Trypsin was added and cells were incubated at 37º until cells were detached for a maximum of 7 minutes. Cells and trypsin solution were suspended in 2 ml of media and pipetted into 15 mL falcon tube and centrifuged for 5 minutes at 3000 RPM. The pellet was re-suspended in 3mL of PBS, 20 µL of which were combined with 20 µL of Trypan Blue. 20 µL were pipetted into a Cellometer Mini slide for counting and analysis of viability. The remaining 280 µL of cell/PBS mixture was centrifuged for 5 min at 3000 RPM, media aspirated, and pellet frozen in -80º for later qPCR analysis.
For qPCR, pelleted cells were removed from the freezer, RNA was extracted from the cells and converted to cDNA. The cDNA was then stored in -20º until ready for qPCR. For each PCR well, 10.5 µL of water, 12.5 µL of Taqman (ThermoFisher), and 1µL (1g) of cDNA was added to the appropriate cells, followed by 1 µL of RNA probe. The housekeeping genes we used as a control were GAPDH and 18s. For the purposes of data analysis, 18s was used as standard of comparison for the other genes. In this study, we analyzed genes which would indicate changes in apoptosis and mitochondrial respiration. For apoptosis pathway interrogation, probes used were p53, p21, BCL2 and CASP3. For Mitochondria function, probes used were NDUF, SDHB, (subunits of mitochondrial complex 1 and 2 respectively) PGC1A, PPARG, TFA-M, NRF-1, COX-2, COX-4, and SOD2.
We then used a Seahorse Bioscience XFp Analyzer to obtain information regarding mitochondrial function in each concentration. We followed the Seahorse XF Mito Stress Test standard procedures. Seahorse plates were prepared at 48hrs, and the analysis was run at 72hrs.
Starting with 60 mm plate, 750 µl of 0.25% Trypsin was added and incubated at 37º until cells are detached, for a maximum of 7 minutes. Cells were then suspended in 1 ml of media with corresponding experimental concentration of metformin, 20 µL of which were combined with 20 µL of Trypan Blue. 20 µL were pipetted into a Cellometer Mini slide for counting. The amount containing 20,000 live cells calculated from the cellometer data from each concentration was diluted with the appropriate media such that 80 µL of the solution contained 20,000 cells. The Seahorse plate was then loaded and stored in a CO2 free incubator for 24hrs, and then run in a Seahorse Bioscience XFp device according the procedure below.
After calibration with seahorse media, and establishment of a basal rate, Oligomycin, FCCP, and a combination of Rotenone and Antimycin were serially added, with three data points collected after each injection. Basal ATP production, Maximal Respiration, Non-mitochondrial respiration, Proton Leak, and Spare Respiratory Capacity were all calculated from the Seahorse Data.
Finally, the 3rd plates for the concentrations 0mM, 0.25mM, and 1mM of Metformin were saved to determine reversibility of the metformin effects. Metformin containing media was aspirated, cells were washed with 2mL of PBS and media was replaced with NG-DMEM. Media was changed after 3 days. After 6 days, 750 µl of 0.25% Trypsin was added and incubated at 37º until cells are detached, for a maximum of 7 minutes. Cells were then suspended in 1 ml of media with corresponding experimental concentration of metformin, 20 µL of which were combined with 20 µL of Trypan Blue. 20 µL were pipetted into a Cellometer Mini slide for counting. The amount containing 20,000 live cells calculated from the cellometer data from each concentration was diluted with the appropriate media such that 80 µL of the solution contained 20,000 cells. The Seahorse plate was then loaded and stored in a CO2 free incubator for 24hrs, and then run in a Seahorse Bioscience XFp device according the XF Mito Stress test procedure used above.
Results
We hypothesized that there would be a dose dependent decrease in cell viability However, through analysis of data from the Cellometer Mini, (cell counter) we concluded that there is no significant differences in the viable cell numbers between each concentration. Cells with no metformin had 86.3% viability, cells at 0.5mM had 89.1% viability, cells at 2.5mM had 100% viability (although there was a 40% reduction in total cell count), and 5.0mM had a viability of 93.1%.
However, the qPCR data indicated that there was an increase in the mRNA expression levels for certain genes involved in apoptosis, particularly at higher concentrations.

Figure 1. qPCR Data from concentrations 0.0mM, 0.25mM, and 1.0mM, normalized to 18s.

Figure 2. qPCR expression data for Metformin Concentrations 0.0mM, 0.5mM, 2.5mM and 5.0mM, normalized to 18s.
The graphs shown above indicate that the expression of p21, p53, and CASP3 all significantly increased at Metformin concentrations of 1mM or greater. No genes pertaining to mitochondrial activity had significant changes in mRNA expression according to the data we collected.
Despite no changes in gene expression of mitochondrial respiration genes, the Seahorse Bioscience Mito Stress Test indicated that Mitochondrial Respiration was affected by the Metformin.

Figures 3-4. Seahorse Stress Test Generated graphs after 72HR Metformin exposure. Baseline for Figure 3 complete after 3 data points; Baseline for Figure 4 complete after 5 data points
As shown by the data, there is a 40% reduction of basal metabolic rate in cells exposed to 0.25mM of Metformin for 72 hours. The Seahorse data shows an 80% reduction in basal metabolic rate for concentrations greater than 1mM of Metformin. However, as will be shown below, the spare respiratory capacity is not significantly altered. Thus, there is then a significant decrease in ATP production in cells with Metformin concentrations of 1mM or greater. No change in non-mitochondrial respiration occurred in concentrations less than 1mM.
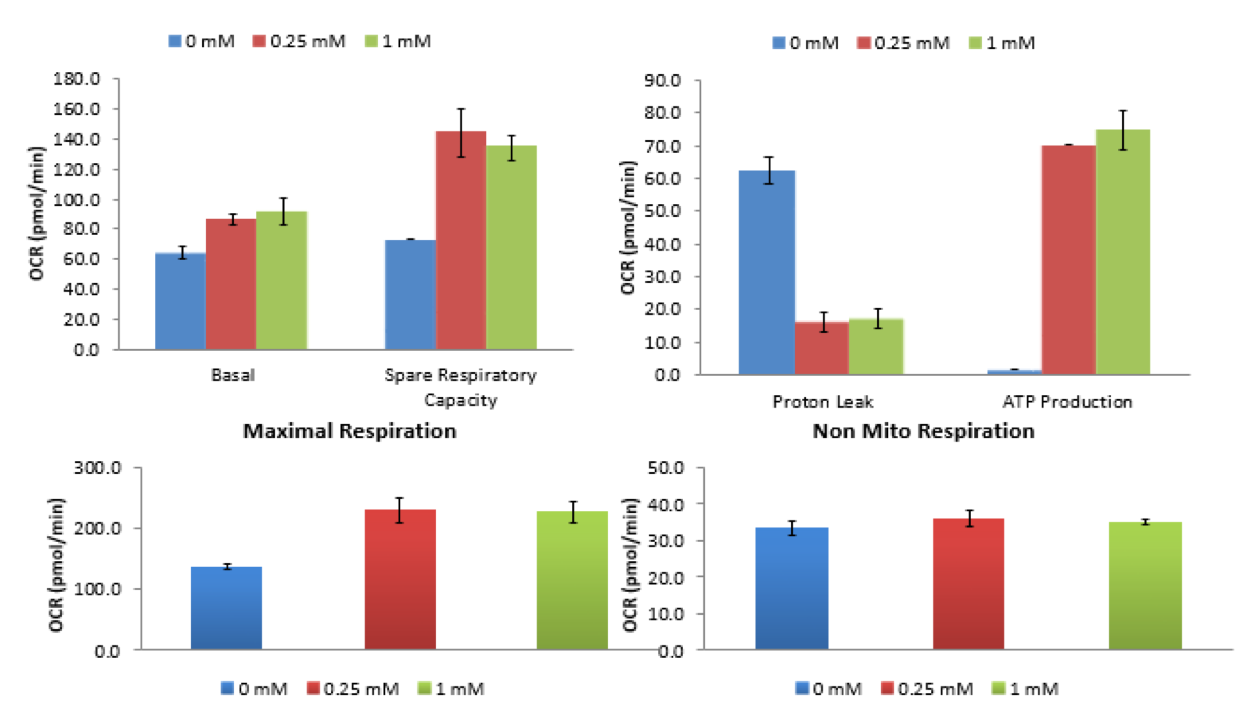
Figure 5. Graphs generated highlighting various values from Seahorse Analysis Program for concentrations 0mM, 2.5mM, and 5.0mM after 72 hrs.
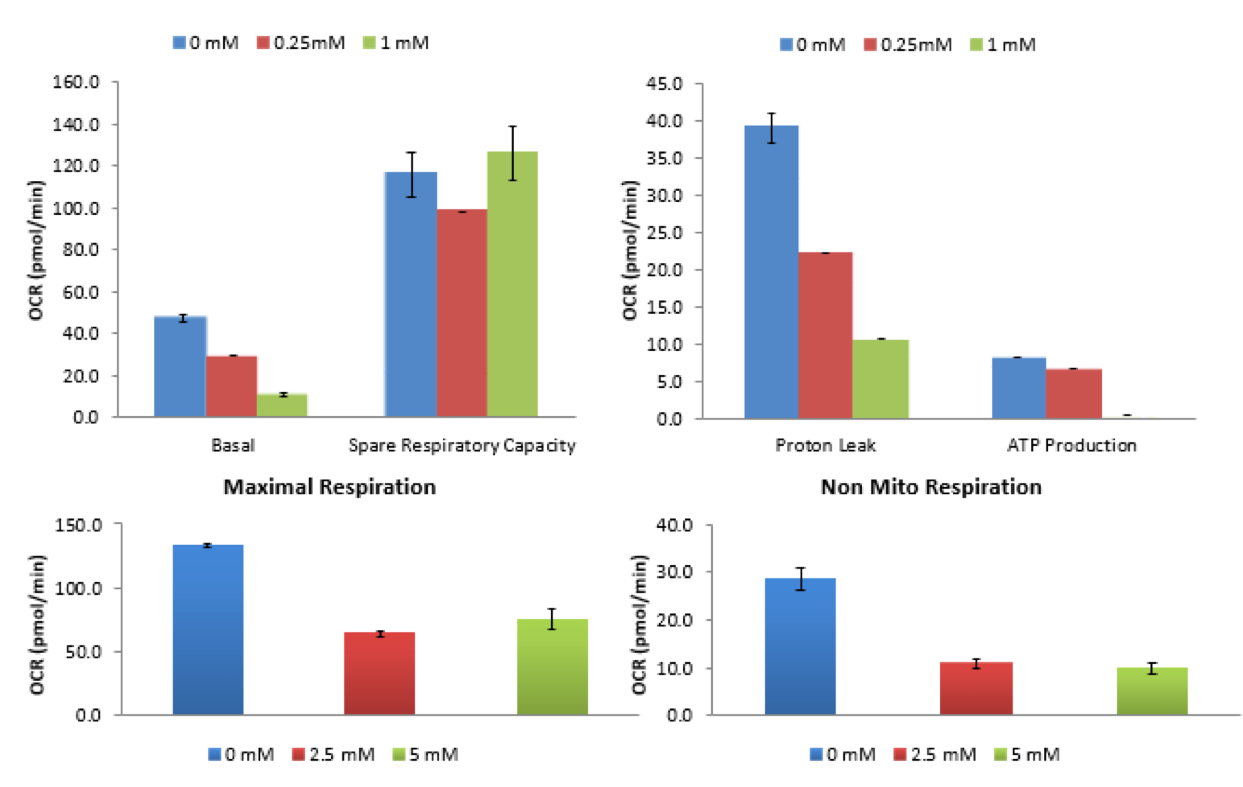
Figure 6. Graphs generated highlighting various values from Seahorse Analysis Program for concentrations 0mM, 0.25mM, and 1.0mM after 72 hrs.
Seahorse analysis was also run for cells that were previously cultured in 0.0mM, 0.25mM, and 1.0mM for 72hrs that were then cultured in Normal Glucose, Metformin-free DMEM for 7 days.
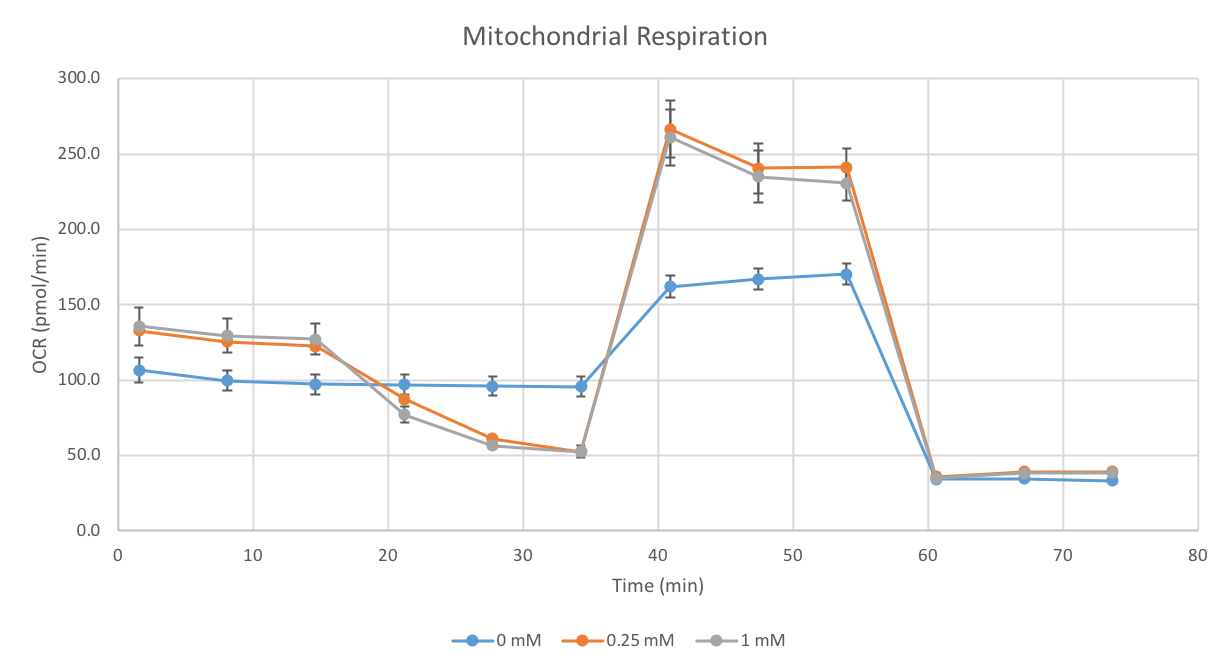
Figure 7. Seahorse Stress Test Generated graphs after 7 days. Baseline complete after 3 data points
The data indicates that there is no longer a deficit in basal oxygen consumption rate in the cells after 7 day culture without exposure to Metformin.

Figure 8. Graphs generated highlighting various values from Seahorse Analysis Program for concentrations 0mM, 0.25mM, and 1.0mM, cultured in no metformin, NG-DMEM for 7 days.
Discussion
We expected that Metformin would reduce the viability of cells to an extent based on the concentration the cells were exposed to. Although there was no statistically significant change in the viability of the cells when exposed to Metformin, the qPCR data analysis suggested an increase in the expression of three important apoptosis genes, p53, p21, and Caspase-3. This suggests that there is a potential increase in programmed cell death activity, despite lack of an alteration in the cell viability percentage during counting.
We also anticipated that Metformin would stimulate a response which reduces the metabolic rate of the mitochondria. The qPCR did not indicate any gene expression change in any of the genes tested regarding mitochondrial respiration. However, a 40%-80% in Basal Oxygen Consumption Rate was indicated by the Seahorse XF data, implying that there was an effect on the mitochondria despite no changes in mRNA levels.
Our study of MSCs indicate that similar effects found in the target cells of Metformin by previously published studies are also detectable in stem cells. What this means is that Metformin not only reduces the mitochondrial activity in order to reduce the glycemic index of patients with diabetes and can suppress the development of cancers, but also impairs the function of stem cells in the body. If MSC metabolic activity is significantly diminished in the patients, then the ability of the cells to perform various functions critical to the patient’s health are reduced. Therefore, we believe that research on this topic can indicate that Metformin is not the safest course of treatment for all patients, and the drug will only be given to a more select group of patients who have no conditions which would require highly-functioning MSCs.
Our study further supports the assertion that complex-1 inhibition by Metformin is a result of an undiscovered signaling pathway, since there was no evidence of alteration in mitochondrial gene expression despite a phenotypic change in mitochondrial activity. The reversibility of the process may indicate a competitively inhibitory process, but is not conclusively suggested by the experiment.
Conclusion
We have shown preliminary evidence that Metformin’s effects on cell viability and mitochondrial oxygen consumption rate are not restricted to cancerous cells, but can have an effect on MSCs. This conclusion is directly shown by the data collected, and is supported by theories generated previously by studies on other cell types. In the future, the mechanism by which Metformin produces these effects, not only restricted to those on MSCs, can be further investigated.
However, the concentrations of Metformin used in this experiment were much higher than would be found at a physiological level, and cells were exposed to the drug for 72 hours, while clinical use of Metformin is generally a long term prescription. Our proposed further research regarding Metformin and MSCs involves using lower concentrations approaching physiological levels, and exposing the cells over a period of minimum 2 weeks, mimicking the clinical use of the drug. However, we still believe, as modeled in previous research, that the concentrations used in the limited timeframe provide insight on to what the processes are in practice.
We hope that further research can uncover the underlying mechanisms to this effect, and that a more controlled use of Metformin in clinics can be developed.
References
[1] Desai, N. R., Shrank, W. H., Fischer, M. A., Avorn, J., Liberman, J. N., Schneeweiss, S., … Choudhry, N. K. (2012). Patterns of Medication Initiation in Newly Diagnosed Diabetes Mellitus: Quality and Cost Implications. The American Journal of Medicine, 125(3), 302.e1–302.e7. http://doi.org/10.1016/j.amjmed.2011.07.033
[2] Kajbaf, F., De Broe, M. E., & Lalau, J. D. (2016). Therapeutic Concentrations of Metformin: A Systematic Review. Clinical Pharmacokinetics, 55(4), 439-459. Therapeutic Concentrations of Metformin :A systematic review
[3] Klubo-Gwiezdzinska, J., Jensen, K., Costello, J., Patel, A., Hoperia, V., Bauer, A., . . . Vasko, V. (2012). Metformin inhibits growth and decreases resistance to anoikis in medullary thyroid cancer cells. Endocrine-related Cancer, 19(3), 447-456. http://dx.doi.org/10.1530/ERC-12-0046
[4] Lindner, U., Kramer, J., Rohwedel, J., & Schlenke, P. (2010). Mesenchymal Stem or Stromal Cells: Toward a Better Understanding of Their Biology? Transfusion Medicine and Hemotherapy, 37(2), 75–83. http://doi.org/10.1159/000290897
[5] Owen, M. R., Doran, E., & Halestrap, A. P. (2000). Evidence that metformin exerts its anti-diabetic effects through inhibition of complex 1 of the mitochondrial respiratory chain. Biochemical Journal, 348(Pt 3), 607–614.
[6] Viollet, B., Guigas, B., Sanz Garcia, N., Leclerc, J., Foretz, M., & Andreelli, F. (2012). Cellular and molecular mechanisms of metformin: an overview. Clinical Science (London, England?: 1979), 122(6), 253–270. http://doi.org/10.1042/CS20110386